It was a short trading week but an interesting one. Our short-term and long-term indicators have flipped to the downside. The fiscal cliff is still undecided and is starting to really affect the market. The VIX is rising which means bigger swings in each direction.
Our short-term (MTT) flipped last Friday and the long-term indicator flipped on Monday. This means we'll only be going short when the MTT tells us to. We'll stay out of the market when the MTT goes long until the long-term indicator goes green. Right now, I'm 100% short.
The fiscal cliff is playing games with the market. Any little news is moving the indexes in both directions. We'll probably have more of the same next week. I expect Congress to pass something next week or early the following week. This should have a positive effect, moving stocks up, but I don't think it will last. We could be going down for a while. In the end, we'll follow the MTT for our trades.
With the fiscal cliff in flux the VIX is rising. A rising VIX means major swings in both directions. This can play mind games with traders, but all we're going to do is follow the MTT. The long-term indicator very rarely flips do to a one day spike so we should avoid the whipsaws that affect so many.
The moral of the story is to follow the MTT. We'll stay short for the time-being and capture any profits we can.
Saturday, December 29, 2012
Friday, December 28, 2012
How Far Will She Go?
Don't let yesterday's close fool it's looking like we are heading further down. Everything was setting up for a big down day until some late fiscal cliff news brought the markets almost to break even. This was a hoax.
The underlying numbers show that the close was nothing more than a show. The markets are headed down. Make sure you are not long and take a short position if you want. I'm short a specific ETF that I'm experimenting with. I'll talk more about it later.
There's always a chance some new fiscal cliff news could come out and send us to the sky, but don't count on it. Until the underlying numbers turn stay short.
Wednesday, December 26, 2012
Slow Fade
The market is slowly fading down. The MTT was down for the second consecutive day but we're still green for the long term. A decent down day will cause the long term trend to go red and we can enter into a short position.
Let's sit back and watch what happens today. If we're down half a percent near the close then enter into a SOXS position. If we're near even or positive then sit tight. A big up day could swing the MTT green and we can get in SOXL.
Let's sit back and watch what happens today. If we're down half a percent near the close then enter into a SOXS position. If we're near even or positive then sit tight. A big up day could swing the MTT green and we can get in SOXL.
Sunday, December 23, 2012
Fiscal Cliff
The fiscal cliff is going to play games with the market until it's resolved. I'm guessing Friday was the first of many days that was affected based on events solely related to the fiscal cliff. There's not much we can do until it's resolved.
These events have led me to alter the MTT trading method. I was going long and short based solely on the MTT readings. After reviewing the past few trades and also trades from the past year I've come to realize it's tough trading against the long term trend.
What I mean by that is if the market is in a nice uptrend but the short term outlook is down then it's better to wait out the short term downside and look for a buy signal.
Friday was a good example of this. Long term we are still in an uptrend (for now). Even though the MTT turned down on Friday I didn't go short. Instead I sitting in cash waiting for a MTT buy signal or for the long term outlook to go short.
Thursday, December 20, 2012
Mixed Signals
Yesterday provided us with some mixed signals, yet, I think we still have room to head higher. After a great day on Tuesday we should have expected sometime type of pullback or consolidation which is exactly what we got. The question we're all wondering is if buyers were taking a profit or if the sellers know something we don't.
According to the MTT this was only consolidation. The market should bounce back today and continue going up for the next 2 - 3 days. With that said, follow the MTT.
According to the MTT this was only consolidation. The market should bounce back today and continue going up for the next 2 - 3 days. With that said, follow the MTT.
Wednesday, December 19, 2012
Santa Claus is Coming to Town
We did in fact turn the corner after a very good day yesterday. The MTT outlook is clear sky's and sunny. The only slight concern is we are nearing overbought territory. Even with that we should have at least a few good days ahead of us.
I sold SOXS and NUGT early yesterday morning after it was apparent the market was strong. I was able to get in GASL and ride that for a 3% - 4% gain. I'm still long and feel it could get to $24 and then $26. I'll ride it out as long as I can.
Many people refer to a surge in stock prices in December as a Santa Claus rally. No one knows exactly sure why prices have a tendency to go up at this time of year. Some people assume because of tax reasons, happiness, or work bonuses. In any case, late December has usually been a good time for the market and the hope is this year will be more of the same.
Tuesday, December 18, 2012
Turning the Corner
Foggy

image courtesy of http://iconka.com
image courtesy of http://iconka.com
After looking over the MTT and the $BPNYA I decided to go long 50% in my 401k. I was planning on waiting for the fiscal cliff talk to be resolved, but the market looks to be turning the corner. It started in the middle to end of November and has continued in December. We usually look for a big breadth day to turn the corner. This time (really this year) it's been a very methodical move up. If this continues I'll get 100% invested.
I'm still short SOXS and long NUGT. The MTT has switched to foggy after barely turning positive yesterday. I'll be looking to get out of SOXS and into SOXL or RUSL if we stay positive through the morning.
The MTT is sitting it the low 150's. This is a tough area to trade in. There's no momentum in either direction and the smallest factor can move the market either way. This is the spot where you can get whipsawed very easily. Hopefully, we'll see a convincing move up today and continue through the end of the year.
Monday, December 17, 2012
Watching and Waiting
It's an interesting time for the market right now. The Market Timing Tool (MTT) has definitely signaled a short-term top. It fell significantly over the past three days. On the other hand, the $BPNYA signaled a buy earlier in the week for long-term accounts.

A long term trade is triggered when the $BPNYA crosses the EMA30 from below as it did on December 11th. I will usually go long in my 401k when this occurs but held back this time because of the fiscal cliff talk going on. The last thing we want is to go long and then have Congress not get a deal done and have the market crash.
As it stands right now, my 401k is in cash and I'm in SOXS at the moment. For full disclosure I also went against the MTT and bought NUGT on Friday. NUGT is a beast of it's own but I usually still follow the MTT with it. On Friday I decided to take a small piece of it based on it's chart and how it's performed lately. We'll see what happens.
I'll have a follow up post with more detail on how I trade my 401k using the $BPNYA and other charts.
Saturday, December 15, 2012
Breadth

Market Breadth is an indicator that tells us how many stocks are going up, how many are going down and how many are unchanged. It gives us an easy way to see how many stocks are participating in the current move.
I'm going to be using the S&P 500 in my examples, but market breadth should be calculated from all stocks -- better yet, all stocks that meet a certain volume criteria. The S&P 500 just makes the examples easier since we're dealing with exactly 500 stocks each time.
Breadth provides a much clearer way of looking at the market than just seeing if the indexes are green or red for the day. For example, the S&P 500 is comprised of 500 stocks. At the end of the day it may be up half a percent. Someone seeing this on the news may think it was a great day for stocks, but let's take a closer look. When we monitor the breadth for the day we notice out of the 500 stocks only 260 finished higher and 240 were lower. It turns out that it wasn't such a great day. Maybe Apple or Pfizer had a great day and skewed the overall index. Breadth will tell you this.
We are looking for a significant breadth move. This is when not much is happening and then all of a sudden 350 out of the 500 S&P stocks are up versus only 150 down. These types of moves usually lead to the start of a bull run. You want to start going long on good setups when you see breadth moves like this.
On the other side when you see only 150 stocks up it could mean the bears have taken control and it's time to get out and watch everyone else lose their money. The market moves in trends so when there's a big move down it will usually continue. This is the time to go short or sit on the sidelines.

Above is an example of a breadth indicator from StockCharts.com. It's a very simple highs vs lows chart. The S&P 500 index is the bottom chart. When highs vs lows is going up there's a good chance we had an up day.
As you can see the beginning of 2012 was a good time to be long. We had a good 4 months of advances but then it got a little shaky. In April you'll notice the bears starting to cause some disruption. At this point you don't need to get out but it should put you on alert. Then in May we experience a sharp drop down.
The great thing about breadth is how consistent it is. For the first four months of 2012 the S&P 500 went up, but even during those four months there were many down days. Yet, the number of advancing stocks kept going up. Following the breadth allows you to stay in the market and not get whipsawed so easily. You are able to ride out those one or two down days so you can take advantage of the three or four bigger up days.
I think we'll stop right here. There's much more to talk about but we'll discuss that in other posts. There's enough here to get everyone started.
Friday, December 14, 2012
Short Term Top

The Market Timing Tool took a good step down after being in an extremely tight range for the previous four or five days. There have been times in the past where it would touch the 150's and then bounce back big to the high 160's or low 170's. Although, the majority of time it continued down to at least the low 150's. We'll stay short and reevaluate at the end of the day. 401k Update coming later today.
Thursday, December 13, 2012
Change of Direction
The market looks like it may be at a short-term top. Our market timing tool (MTT) has changed directions to the downside. It was a very slight move down so we're looking for a stronger follow through today to confirm the trend.
I bought SOXS during the day yesterday. We'll watch the MTT at the close today and let it tell us what we need to do.
I would have liked to see the MTT get a little higher. Once it reaches the high 160's or low 170's it almost always means we've reached a top and a pullback is in order. That can still happen in the low 160's but it leaves some doubt that we can be in flux. I'll expand on this more at a later time.
Friday, August 31, 2012
Big Ben

Ben Bernanke is set to give his Jackson Hole speech today and according to the futures, the markets are expecting him to do something big. As of now, the losses from yesterday are all but wiped out and that's before the speech. If Ben does say anything of substance we could have ourselves a massive day.
If your long, this all looks and sounds great. I'm not buying it -- maybe that's because I'm currently short. On the other hand, when looking over the data for the past week or so I'm noticing weakness all other. In my opinion, it would take a great speech by Bernanke to revive it but I don't see it. This is probably the Fed's last round of ammo and I just don't see him using it right now. The economy is not in great shape but it's also not in a free-fall.
I will remain short until at least the end of the day. If the Jackson Hole speech causes some ruckus in the market I'll look to get long, but at this time, I'm not expecting too.
Thursday, August 30, 2012
Down She Goes, Right?
I spent the weekend gathering data to give me a better view of the market. Think of standing on a big hill looking over things instead of standing in the middle of the city street watching cars and people go all around you. When you're right in the middle of the action it can be hard to see what's really happening, you get caught up in the commotion. Taking a few steps back allows you to remove yourself from the day-to-day hussle and bussle.
When I completed this task I noticed the market has actually been growing nicely for the past 3 months or so. I also noticed it has started to weaken over the past week. Looking at past data shows after an 8 - 12 week upswing we're probably in for a multi week correction.
I sold 25% of my 401k account. I would have sold 75% - 100% but I can only trade a fund once every 30 days and I bought it about two weeks ago. That means I have to wait two more weeks before I can get out of that position.
I'm also short the market right now. I'm sitting in DUST and RUSS. RUSS is definitely weak and should continue down with the market. DUST on the other hand is a bit riskier. It has been known to go against the market but after looking over it I feel confident that is has room to move down.
Monday, August 20, 2012
Creeper
The market continues to creep higher. This rally has been extremely strange and very hard to trade. My market timing works best when the things are volatile, not when there are small up and down days.
The plan remains the same, I'll trade the way the tool tells me too. In the end this may be good for me as it may strengthen my ability to control my emotions.
I'm long EDC at the moment. The market continues to look weak, so who knows how long I'll be in it.
The plan remains the same, I'll trade the way the tool tells me too. In the end this may be good for me as it may strengthen my ability to control my emotions.
I'm long EDC at the moment. The market continues to look weak, so who knows how long I'll be in it.
Thursday, August 16, 2012
Weakness...
Not market weakness, but my weakness. After a series of small losses over the past few days, I went long yesterday afternoon before my timing tool said to. To be fair, it was on the bubble of turning green, but hadn't done so just yet. I also try to trade only late in the day and this I bought somewhere around 1:00pm.
This is a weakness that I have. I always jump the gun and pay for it in the end. There's a chance it may work out this time, but it's still no excuse. I may try to analyze this situation and write a longer post about it.
In any case, I'm long SOXL. I still don't think the market has much upside, but maybe I can get two or three bucks out of it.
Wednesday, August 15, 2012
5th Day of Correction
Tuesday was the 5th day of the latest correction. It was another very blah kind of day. The markets were up for most of the day before a late collapse and then a last minute buy that brought them back to about breakeven.
My timing tool shows it as a weak day, similar to the last few days. I'm hoping for a big down day before it shoots up to challenge the latest highs.
Monday, August 13, 2012
Switching to GASX
Even with the end of day rally, the market remains weak. I'm switching to GASX, the weakest of the 3x ETF's.
Eeny, Meeny, Miny, Moe
That's basically what the market has been for the past three or four days. My timing tool is still showing the market as weaker, as such, I'm still short. I did switch over to RUSS on Friday, although I now wish I would have stayed in EDC. I may go back to EDC today. We'll see how the day ends.
Various blogs and news sites feel the market will continue to go higher from here. I'm not seeing it. I will say the market has held up well these past few days, but I feel that over the next week or two we will be lower than we are today. I do think we will get a one or possibly two day bounce this week, but I think it will be more of a fake-out before the big selling comes in.
I have not been sold on this two month rally (I'm not sure you can call it a rally.) We never hit a bottom at any point before that. It came close on 6/4 and a another day or two of selling would have been great. Instead the market bounced up and we are where we are today.
I'll continue to rely on my market timing tool. If it does reverse to a buy I'll trust it and get in.
Friday, August 10, 2012
Which Way Do We Go?
I ended up staying in EDZ yesterday. I was monitoring my market timing tool very closely around 3:45 but it never gave a clear buy or sell. Since the indexes never moved up after 1:00pm, and actually had a weak close, I decided to keep my short position.
I will continue to keep a close eye on things today, looking for some kind of signal, either long or short. If I had to make a prediction I would say we're headed lower next week. We're oversold and one of my indicators is getting very close to a top. Although, it can hang around up there for a while before reversing. That's why the timing tool has a set of indicators that all must switch.
I will continue to keep a close eye on things today, looking for some kind of signal, either long or short. If I had to make a prediction I would say we're headed lower next week. We're oversold and one of my indicators is getting very close to a top. Although, it can hang around up there for a while before reversing. That's why the timing tool has a set of indicators that all must switch.
Thursday, August 9, 2012
Stay the Course...
As mentioned in the last post, the market did indeed turn higher. It's struggling to stay afloat today, but I think it probably will end positive or very close to it.
I made a crucial mistake late in the trading day yesterday. The market looked like it may start to roll over. I was in GASL and it was coming back down to my buy price. I had a stop in place a few pennies above that but decided to sell and make a very small profit. My main reason for doing this was my market timing tool was getting very close to a sell. If the market continued to go down the tool would definitely told me to go short. I've learned, or at least experienced, many times that nothing is 100%. The market decided to end the day higher and my market timing tool stayed positive.
Selling GASL wasn't the worst trade in the world. My big mistake was what I did next. Feeling the market was rolling over I bought EDZ. Sure enough, I was quickly in the red this morning and although the indexes have been around breakeven all day I'm still down. Meanwhile, GASL has been up 4% - 5% most of the day.
I now find myself in a tough situation. If my timing tool stay positive today, I have to sell EDZ. The problem is it's probably too late to get in a bull ETF. This may mean I miss a big run. What I may do is take a half position in something at the end of the day. We'll see how we finish.
The lesson learned is don't jump the gun. Many things happen during the day. Wait until the last 30 minutes and place your trades according to what the timing tool is telling us. Don't try to predict how the day will end.
Thursday, July 26, 2012
Market Timing
I've been in hiding for the past 6 months while I changed my trading strategy. Despite what the experts lead you to believe, the market can be timed. It's probably impossible to get in at the lowest point and out at the highest but that's not what I'm trying to do. My goal is to get in somewhere near the bottom, ride the trend up and get out somewhere near the top. This can be done! It takes much practice and determination, but it's achievable.
I once heard someone say if you ask someone if they could walk a tightrope across Niagara Falls they would tell you it's impossible. Yet, with practice and determination certain people can do it, as proven in 2012. The vast majority of the population can't but people who make it a goal of theirs can succeed. It's the same concept when trading and timing the market.
With that said, I have spent the past few months creating a market timing system. It tells me when the market is trending higher and when it will or is reversing. I trade 3x ETF's, bull and bear. This means I don't care what direction the market is going, I can trade both sides.
I've back-tested this and feel semi-comfortable with it, but back-testing has it's limits and you won't really know until you start trading it. That's what I've started doing and I will be posting my results with some commentary.
Most of my trades will last 3 - 7 days, but some may be shorter or longer. Shorter trades may mean I'm getting whipsawed and longer trades usually mean I'm making lots of moolah. As you can plainly see longer trades are better.
I'm going on vacation next week, so this is not a great time to start. I will post my current trades and will give my prediction for next week. The prediction is based more on feel which I'm gaining by punching in and reviewing the numbers of my market timing strategy.
As of today, I'm short and have been playing RUSS and GASX for the past 3 or 4 days. RUSS was extremely kind to me and I switched to GASX when I felt RUSS was overextended. I feel the market may bounce back higher sometime in the next couple of days. If it doesn't we could be headed for a big sell off over the next five days or so.
Let's see what happens. In the end, my trades will be based off of my market timing tool.
Thursday, February 16, 2012
Lack of Fear
With the recent bull market the spread between the Nasdaq 100 and VXN is at an all-time high. With Apple coming back below $500 and the market in a short term correction it may be time to build a small position in VXX.


Wednesday, February 15, 2012
It's Dug
Just a quick note. I've been following DUG for the past few days and if it can get over $22.65 then it may run much higher. Watch it carefully and wait for that to happen before entering.


Is GDM Trying To Tell Us Something?
The gold miners index has fallen for the past few days. It's now touching support and could tell us what will happen to GLD. GDM has usually traded lockstep with GLD, but recently it has stayed behind. Is it foreseeing the future or just being cautious? If it falls through support then expect GLD to come crashing down with it. If it holds, then I would expect GLD to rise in the short term.


Tuesday, February 14, 2012
Good Wins Out?
YINN is trying to break out of a multi year descending channel. Here's a look at the weekly chart. Usually, when it fails, it fails hard. Let's see where we end up at the end of the week. Anything above $27 is a buy.


One More Surge
SPY is up against the July highs. The Greek austerity package gave it a boost yesterday and it will probably need one more kick to get it over the hump. Getting past $135.70 would be very good for the market. The next stop will be $137.18 which it reached back in May. The resistance their will be much stronger but breaking it would be huge. First things first, $135.70.


Sunday, February 12, 2012
What Gives?
Two different currency charts will be touching support this week. Which one holds might give us a look at where the market headed.
The AUD/USD is usually in step with SPY. In the next day or two it will probably hit the bottom of it's ascending channel. Will it hold?

Meanwhile, the USD/CHF has, for the most part, gone the opposite of SPY. It is now hitting it's short term support and also multi-year support. Back in July 2010 it came down to support, snugged the line for a while and then dropped. Will the same happen this time?

Let's keep a close eye on these two charts and watch which one holds. It should give us a clue on where we are headed.

Meanwhile, the USD/CHF has, for the most part, gone the opposite of SPY. It is now hitting it's short term support and also multi-year support. Back in July 2010 it came down to support, snugged the line for a while and then dropped. Will the same happen this time?
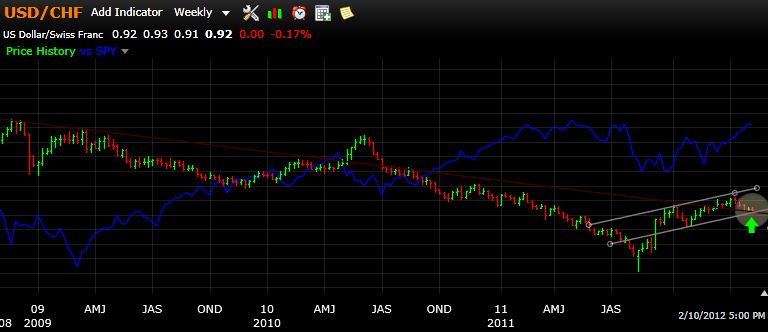
Let's keep a close eye on these two charts and watch which one holds. It should give us a clue on where we are headed.
Saturday, February 11, 2012
Have we seen this before...
Could the market be ready to take a breather? The MO shows we have gone negative for the short term. It also shows the overall market is extended and could be ready to snap back.
The IYM chart below shows it came up against multiple points of resistance. It dropped on Friday so we'll see what happens on Monday. We've been in a nice uptrend since December -- it would not be surprising to see the market regroup for a week or so and then start the move back up. Monday and Tuesday will tell us a lot but the MO and the charts are saying IYM will test $67.00 in the next 5 - 10 days. Take any gains off the table from the past month or so and think about buying SMN or even TZA.

The IYM chart below shows it came up against multiple points of resistance. It dropped on Friday so we'll see what happens on Monday. We've been in a nice uptrend since December -- it would not be surprising to see the market regroup for a week or so and then start the move back up. Monday and Tuesday will tell us a lot but the MO and the charts are saying IYM will test $67.00 in the next 5 - 10 days. Take any gains off the table from the past month or so and think about buying SMN or even TZA.

Tuesday, February 7, 2012
Market Outlook (MO)...
Over the past few weeks I've been working on a system that monitors the overall trend of the market. I'm calling it the Market Outlook or MO for short. The MO will give the short term and long term trends of the market, as well as, an overall outlook of the market. These three values will tell us when we should be trading and when we should be sitting on the sidelines. It will also give us an idea of when the market has stretched too far in either direction -- basically, when the rubber band will snap back.
To recap:
Market Outlook (MO)
The goal is to be able to get an overall feel of the market in 10 seconds or less by looking at the MO.
To recap:
Market Outlook (MO)
- Short term trend
- Long term trend
- Overall outlook of market
- When the market has stretched too far to either side
The goal is to be able to get an overall feel of the market in 10 seconds or less by looking at the MO.
Subscribe to:
Posts (Atom)