
Thursday, February 16, 2012
Lack of Fear
With the recent bull market the spread between the Nasdaq 100 and VXN is at an all-time high. With Apple coming back below $500 and the market in a short term correction it may be time to build a small position in VXX.

Wednesday, February 15, 2012
It's Dug
Just a quick note. I've been following DUG for the past few days and if it can get over $22.65 then it may run much higher. Watch it carefully and wait for that to happen before entering.


Is GDM Trying To Tell Us Something?
The gold miners index has fallen for the past few days. It's now touching support and could tell us what will happen to GLD. GDM has usually traded lockstep with GLD, but recently it has stayed behind. Is it foreseeing the future or just being cautious? If it falls through support then expect GLD to come crashing down with it. If it holds, then I would expect GLD to rise in the short term.


Tuesday, February 14, 2012
Good Wins Out?
YINN is trying to break out of a multi year descending channel. Here's a look at the weekly chart. Usually, when it fails, it fails hard. Let's see where we end up at the end of the week. Anything above $27 is a buy.


One More Surge
SPY is up against the July highs. The Greek austerity package gave it a boost yesterday and it will probably need one more kick to get it over the hump. Getting past $135.70 would be very good for the market. The next stop will be $137.18 which it reached back in May. The resistance their will be much stronger but breaking it would be huge. First things first, $135.70.


Sunday, February 12, 2012
What Gives?
Two different currency charts will be touching support this week. Which one holds might give us a look at where the market headed.
The AUD/USD is usually in step with SPY. In the next day or two it will probably hit the bottom of it's ascending channel. Will it hold?

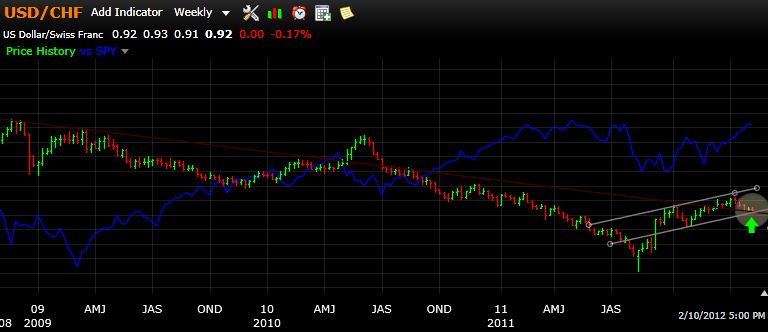
Meanwhile, the USD/CHF has, for the most part, gone the opposite of SPY. It is now hitting it's short term support and also multi-year support. Back in July 2010 it came down to support, snugged the line for a while and then dropped. Will the same happen this time?

Let's keep a close eye on these two charts and watch which one holds. It should give us a clue on where we are headed.

Meanwhile, the USD/CHF has, for the most part, gone the opposite of SPY. It is now hitting it's short term support and also multi-year support. Back in July 2010 it came down to support, snugged the line for a while and then dropped. Will the same happen this time?
Let's keep a close eye on these two charts and watch which one holds. It should give us a clue on where we are headed.
Saturday, February 11, 2012
Have we seen this before...
Could the market be ready to take a breather? The MO shows we have gone negative for the short term. It also shows the overall market is extended and could be ready to snap back.
The IYM chart below shows it came up against multiple points of resistance. It dropped on Friday so we'll see what happens on Monday. We've been in a nice uptrend since December -- it would not be surprising to see the market regroup for a week or so and then start the move back up. Monday and Tuesday will tell us a lot but the MO and the charts are saying IYM will test $67.00 in the next 5 - 10 days. Take any gains off the table from the past month or so and think about buying SMN or even TZA.

The IYM chart below shows it came up against multiple points of resistance. It dropped on Friday so we'll see what happens on Monday. We've been in a nice uptrend since December -- it would not be surprising to see the market regroup for a week or so and then start the move back up. Monday and Tuesday will tell us a lot but the MO and the charts are saying IYM will test $67.00 in the next 5 - 10 days. Take any gains off the table from the past month or so and think about buying SMN or even TZA.

Tuesday, February 7, 2012
Market Outlook (MO)...
Over the past few weeks I've been working on a system that monitors the overall trend of the market. I'm calling it the Market Outlook or MO for short. The MO will give the short term and long term trends of the market, as well as, an overall outlook of the market. These three values will tell us when we should be trading and when we should be sitting on the sidelines. It will also give us an idea of when the market has stretched too far in either direction -- basically, when the rubber band will snap back.
To recap:
Market Outlook (MO)
The goal is to be able to get an overall feel of the market in 10 seconds or less by looking at the MO.
To recap:
Market Outlook (MO)
- Short term trend
- Long term trend
- Overall outlook of market
- When the market has stretched too far to either side
The goal is to be able to get an overall feel of the market in 10 seconds or less by looking at the MO.
Subscribe to:
Posts (Atom)